
Fort Washington Is a 1976 Housing Stock. Here Is What That Means (Part 28 of 30: The Fort Washington Files)
This is Part 28 of The Fort Washington Files from Donnell Williams Jr. and DMV Prime Properties, a thirty-part series built entirely on what 689 Fort Washington listings actually did in 2026.
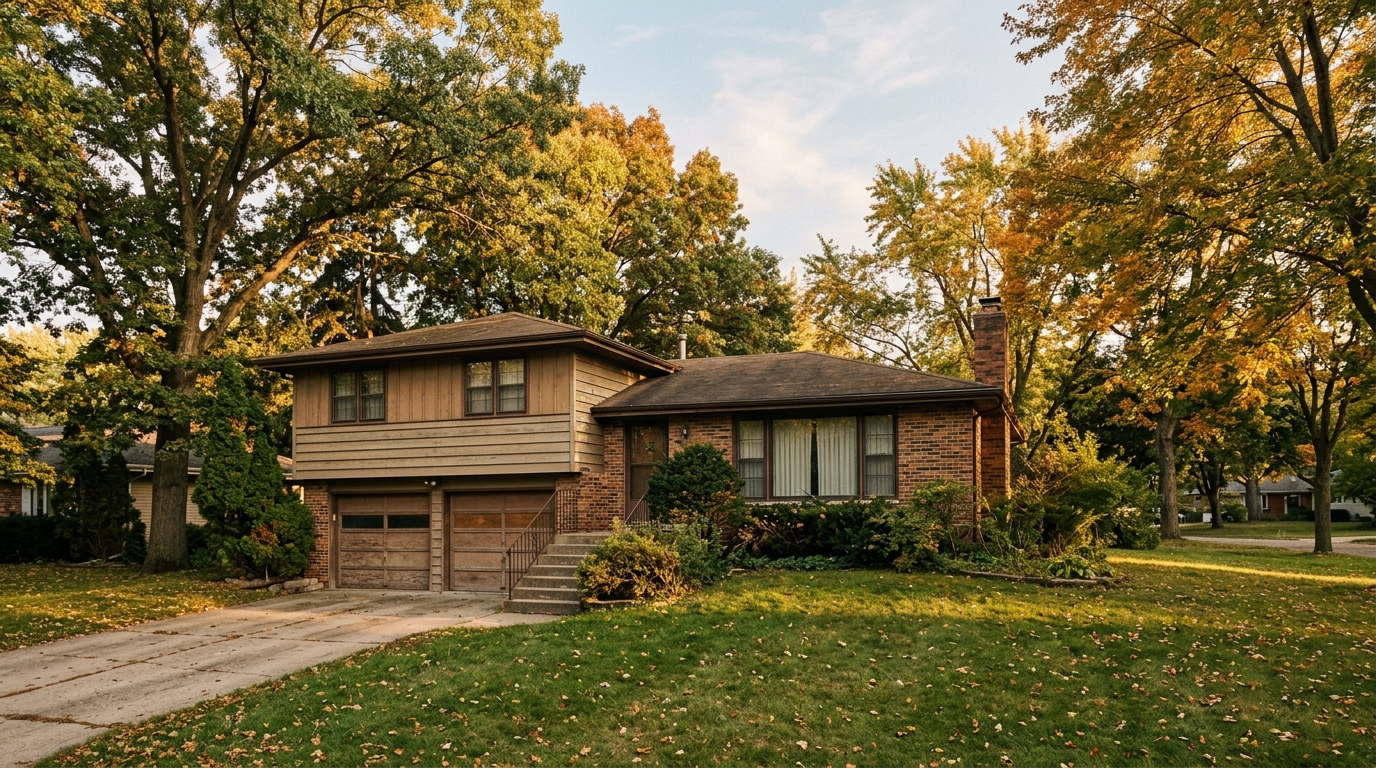
The median Fort Washington home that closed this year was built in 1976. Not remodeled in 1976. Built in 1976.
That single number explains more about buying and selling in this zip code than almost any other figure in the export, and most buyers arriving from elsewhere in the region do not know it before their first showing.
The decade breakdown, by count
Across the 361 closed sales in Donnell's Bright MLS export, covering 689 Fort Washington listings tracked through September 17, 2026, the closings sorted by decade built like this:
- 1970s: 98 closings
- 1960s: 78 closings
- 1990s: 60 closings
- 1980s: 51 closings
- 1950s: 30 closings
- 2000s: 17 closings
The 1970s and 1960s together account for 176 closings. The 2000s account for 17. Those six decades cover 334 of the 361 closed sales.
This is not a market where a buyer chooses between old and new. It is a market where a buyer chooses among houses built between roughly 1950 and 1999, and then decides how much updating they want to take on.
The counterintuitive part: older sold higher per square foot
Price per square foot by decade runs in almost the opposite direction from what people expect.
The 1960s homes closed at $310 per square foot, the highest of any decade, on 78 sales at a $459,450 median and 12 days on market. The 1950s came in at $286 per square foot on 30 sales at a $420,000 median. The 1970s came in at $263 on 98 sales at a $457,500 median. The 1980s came in at $275 on 51 sales at a $467,620 median. The 1990s came in at $236 on 60 sales at a $507,500 median. And the 2000s came in at $215 per square foot, the lowest of any decade, on 17 sales at a $675,000 median.
Part 10 of this series worked through the mechanics of that. The short version is that the newer decades in Fort Washington built bigger houses. A 2000s home carried a $675,000 median, well above the zip code's $470,000, but it spread that price over far more square footage, so each foot cost less.
A buyer who shops strictly by price per square foot in this zip code ends up in newer, larger, more expensive houses. A buyer who shops by total price ends up in the 1960s and 1970s stock. Both are rational. They are just different searches.
What the typical closed home actually contained
The structural columns in the export describe a fairly consistent house.
Of the 361 closed sales, 300 had a basement and 61 did not. Fireplaces appeared in 252. Central air appeared in 260, which means 101 closed sales did not have it. Garage counts ran 68 with one space and 140 with two, plus 4 with three spaces and 1 with four.
The median above-grade size was 1,716 square feet, the median lot was 0.28 acres, and four bedrooms was the most common configuration at 181 of 361 closings. The median sale price was $470,000 and the median price per square foot on sale price was $265.
Only 4 of the 361 closed sales were waterfront, so the water is nearby rather than underfoot for nearly everyone here.
The below-grade number that surprises people
Here is a detail worth pausing on. Three hundred of 361 closed sales had a basement, yet the median below-grade square footage recorded across those closings was zero.
That is a documentation fact more than a construction fact. It means that for more than half the closed listings, no finished below-grade square footage was recorded in the listing data, even though the house had a basement.
Two things follow from that. First, the $265 per square foot median in this zip code is calculated on above-grade space, so a house with a finished lower level is delivering living area that the per-foot math does not capture. Second, a seller with genuinely finished, permitted lower-level space is leaving value on the table if the listing does not document it properly, and a buyer comparing two listings on square footage alone may be comparing an accurate number against an incomplete one.
What to have inspected in a house of this vintage
None of what follows is a prediction about any particular house. It is a checklist shaped by the age of the stock, and a licensed home inspector is the person who answers each item for a specific property.
In a home built in the 1960s or 1970s, the components a buyer should ask about directly include the age and remaining life of the roof, the electrical service panel and the type and capacity of the branch wiring, the supply and drain plumbing and what material it is made from, the heating and cooling equipment and the condition of the ductwork, the water heater, the windows and the level of attic and wall insulation.
Because 300 of the closed sales had basements, moisture belongs on the list as well: exterior grading and drainage around the foundation, gutters and downspout discharge, any sump equipment, and evidence of past water. Because 252 had fireplaces, the chimney, flue and any liner deserve their own look from someone qualified to evaluate them.
Older homes also carry disclosure obligations that newer ones do not. Federal lead-based paint disclosure requirements apply to housing built before a certain date, and Maryland has its own disclosure rules for residential transfers. Donnell is a broker rather than an attorney, an inspector or a contractor, and a buyer should confirm which disclosures apply with their agent, their attorney and a licensed inspector rather than assuming.
The new construction alternative barely exists
A buyer who reads all of the above and decides to skip the vintage question entirely by buying new has a very short list to work from.
Only 9 of the 361 closed sales in the export were new construction. Their median sale price was $835,235, their median time on market was 7 days, and they ranged from $710,000 to $1,500,000. Seven of the nine were in Gallahan Estates, one was in Spring Ridge and one was in Tantallon on the Potomac. Gallahan Estates on its own produced 7 closings at a $835,235 median and a median of 1 day on market.
Nine closings out of 361 is 2.5 percent of the year's sales, at a median roughly $365,000 above the zip code median. Fort Washington is overwhelmingly a resale market, and the practical choice here is not new versus old. It is which older decade, at what level of updating.
The ownership structure reflects the same history. Only 78 of the 361 closed sales, 22 percent, carried a homeowners association, at a median fee of $77.50 per month. In most of this zip code, maintenance decisions belong to the owner rather than to an association, which is freedom and responsibility in the same sentence.
The 101 without central air
That number deserves its own paragraph because it changes a showing.
A hundred and one of the 361 closed homes had no central air conditioning recorded. In a region where summer is not optional, that is a meaningful share of the market, and it is exactly the kind of thing a buyer relocating from a newer subdivision does not think to check on a listing sheet.
It is not a disqualifier. Plenty of those 101 sold, and they sold inside a market with an 18-day median. It is a line item to price into the plan, and a question to ask before the second showing rather than after the inspection.
What this means for a seller
A Fort Washington seller is competing against other homes of roughly the same vintage. That is the useful frame.
The export shows what happens when the price does not match what the house is. Across the full 689 listings, 144 of the 505 that left the market left without selling, a 28.5 percent failure rate. Those failed listings carried a median original list price of $534,748 and a median 1,952 above-grade square feet, against $479,900 and 1,716 square feet for closed sales.
On a per-foot basis they were priced almost identically to what sold, at $267 against $273. They were not overpriced per square foot. They were bigger houses priced at an absolute number the local buyer pool could not reach.
Condition and updating are how a seller of a 1976 house moves within that reality. Half of failed listings cut their price, at a median of $25,000, and still did not sell. Only 29 percent of closed listings ever cut at all, and the 257 sellers who never cut sold in a median of 11 days at exactly 100 percent of their original list.
Where updating actually shows up in the numbers
The export does not record renovation quality, so nobody should claim it does. What it records is time and price, and time is where preparation tends to show.
The 100 Fort Washington homes that closed within seven days sold at a median of $479,000 with only 13.0 percent coming in below original list. From 31 to 60 days, 72.5 percent came in below original. Past 90 days, 94.3 percent did.
A seller of an older home who handles the obvious items before listing is buying position in the first bracket. A seller who leaves them for the inspection negotiation is more likely to be negotiating in the fourth. That is a reasonable inference from the pace data rather than a promise, and it matches what Donnell sees on the ground in this zip code.
Know what you are buying before you fall for it
A 1976 house can be a very good purchase, and it can be an expensive lesson, and the difference is almost always what somebody knew before closing. Donnell Williams Jr. is the broker-owner of DMV Prime Properties at 12815 Old Fort Road in Fort Washington, and he walks older homes here every week. He will tell a buyer what to look at in a specific property, connect them with licensed inspectors who know this housing stock, and pull the closed comparables for homes of the same decade and size in the same pocket. Call 301.818.0313 or email donnell@dmvprimerealty.com before writing on an older Fort Washington home.
Part 29 of The Fort Washington Files is the honest version of living here, in residents' own words, set against what the housing numbers actually show.


